

| Cavity balance — simultaneous fill of all cavities under identical pressure, temperature, and shear conditions — is the critical determinant of multi-cavity tooling economics. In high-volume production (500K+ cycles annually), imbalance drives cascading failures: dimensional variance exceeding ±0.05 mm, simultaneous flash and short shots in the same tool, and accelerated wear. |
Most engineers assume a geometrically balanced (H-pattern) runner system guarantees uniform fill. It doesn’t. Shear heating at runner walls creates a temperature stratification — discovered and documented by John Beaumont of Beaumont Technologies — that causes inner cavities to fill 10–30% faster than outer cavities, even when all flow paths are mathematically equal length. [1]
This guide covers the six governing design parameters, rheological mitigation strategies, and process validation protocols.
Why Geometrically Balanced Runners Still Imbalance
Three physical mechanisms create flow disparity in multi-cavity tools. All three can occur simultaneously, and none can be corrected by changing only process parameters — they require design-level solutions.
Shear-Induced Viscosity Stratification (The Beaumont Effect)
As polymer melt traverses runners, viscous friction generates heat at the runner walls. The outside of the melt stream heats up; the core stays cooler. When this stratified melt reaches a runner bifurcation and turns a corner, the hot outer material ends up on one side of the downstream runner — and the cool inner material ends up on the other.
In an 8-cavity H-pattern tool, after two bifurcations, the four inner cavities receive predominantly hot, low-viscosity melt while the four outer cavities receive cooler, higher-viscosity melt. For 20% glass-filled nylon 66 at 280°C, inner cavity melt can reach 295°C, reducing viscosity by approximately 25%. Inner cavities fill faster, overpack, and flash; outer cavities underfill and short-shot. Both defects occur in the same tool, same shot. [1]
This is the Beaumont Effect — and it occurs in naturally balanced, geometrically symmetric runners. Runner geometry alone cannot prevent it.
Pressure Drop Differentials
The Hagen-Poiseuille equation governs pressure loss in cylindrical runners: ΔP = (8 × μ × L × Q) / (π × R⁴). Where μ represents dynamic viscosity, L is flow length, Q is volumetric flow rate, and R is runner radius
The fourth-power relationship on radius means a 5% variation in runner diameter creates approximately 22% differential in pressure drop. CNC machining tolerances of ±0.05 mm on a 6 mm diameter runner represent a 1.7% diameter variation — enough to create measurable fill imbalance in high-cavitation tools.
Inner cavities experience over-packing (flash, warpage); outer cavities exhibit under-packing (sink marks, shrinkage). This pressure-driven component adds to the viscosity-driven Beaumont Effect rather than substituting for it.
Thermal Stratification from Uneven Cooling
In semi-crystalline polymers (PP, PA, POM), differential cooling rates across the mold face alter crystalline morphology. Rapid cooling produces smaller spherulites — higher density, lower shrinkage. Slow cooling allows larger crystal structures — lower density, 0.4–0.6% additional shrinkage.
A 5°C temperature differential between cavity faces can drive shrinkage variation of 0.3–0.5%. This coefficient of linear thermal expansion (CLTE) mismatch creates assembly failures in precision applications like automotive connectors or medical luers.
Six Parameters That Govern Cavity Balance
1. Geometric Symmetry in Runner Layouts
Fundamental Rule: Maintain identical flow length (L) and hydraulic diameter (D) from machine nozzle to each cavity gate within ±0.5% tolerance.
Implementation Protocols:
• Naturally Balanced Layouts: Deploy H-pattern configurations for 4/8/16/32 cavities, or radial/star patterns for circular tools. These ensure equivalent flow paths regardless of cavity location.
• Machining Tolerances: CNC EDM machining must maintain ±0.05mm on runner diameters, with surface finishes Ra 0.4-0.8μm to minimize viscous drag variations.
• L/T Ratio Constraints: Maintain flow length-to-thickness ratios below 200:1. Ratios exceeding this threshold risk premature freeze-off in outer cavities before packing completion.
Engineering Calculation for Family Molds:
For asymmetrical part layouts requiring different cavity volumes, employ variable runner diameter sizing based on the Hagen-Poiseuille relationship:
d₁/d₂ = (V₁/V₂)^(1/4)
Where d represents runner diameter and V represents cavity volume. This compensation ensures equal fill times despite heterogeneous geometries
| ⚠ Geometric balance is necessary but not sufficient. It prevents pressure-drop imbalance but does not prevent the Beaumont Effect (shear-induced viscosity stratification). All six parameters must be addressed together. |
2. Shear-Induced Viscosity Management
Phenomenon Analysis:
Inner cavities (proximal to the nozzle) typically fill 10-30% faster than outer cavities due to cumulative shear heating. For 20% glass-filled nylon 66 processed at 280°C, inner cavity melt may reach 295°C, reducing viscosity by approximately 25% through shear-thinning behavior
Mitigation Strategies:
Melt Rotation Technology (MRT):
Flow-flipping mechanisms (Beaumont MeltFlipper, iMARC) installed at runner bifurcations reorient the melt stream, bringing the hot outer material to the center of the downstream runner and the cool core to the outside. This re-homogenizes the melt before it reaches the next bifurcation, preventing cumulative stratification over multiple branching levels.
MRT is the most reliable solution for tools with three or more runner branching levels.
Sequential Valve Gating (SVG):
For hot runner tools, program valve pin actuation timing to compensate for fill rate differentials: delay inner cavity gates 0.3–0.5 seconds after injection start, run middle cavities at standard timing, and open outer cavity gates early or extend their fill time.
SVG is highly effective but requires a hot runner system and accurate process characterization before production.
Temperature Profile Modulation:
Adjust hot runner manifold zone temperatures to offset Beaumont Effect viscosity differentials: outer cavity drops +8–12°C above nominal, inner cavity drops at nominal temperature. Verify with IR thermography confirming ±3°C uniformity at gate entry.
This approach works within a limited viscosity correction range and is most effective combined with SVG.
3. Thermal Uniformity Control
Specification Standard: Maintain mold surface temperature differential ΔT <3°C across all cavity faces.
The two most common deviations from this target are series-configured cooling circuits and laminar (non-turbulent) coolant flow.
Cooling Circuit Engineering:
• Parallel Configuration: Utilize parallel cooling circuits (never series) to ensure equal coolant flow rates.
• Turbulent Flow Requirement: Maintain Reynolds number Re > 4,000 in all cooling channels. Below Re 4,000, coolant flows in smooth laminar layers with minimal mixing and poor heat transfer — the effective heat transfer coefficient drops 3–5× compared to turbulent conditions.
The Reynolds number is calculated as: Re = (ρ × v × D_h) / μ Where ρ is coolant density, v is velocity, and D_h is hydraulic diameter.
• Temperature Delta Constraints: Limit coolant inlet-to-outlet temperature rise per circuit to <2°C (3.6°F)
• High-Conductivity Inserts in Gate Areas: Gate areas accumulate heat from the incoming melt stream faster than adjacent mold steel can dissipate it. Beryllium-copper (BeCu) inserts (thermal conductivity 120–140 W/m·K versus steel at 40 W/m·K) in gate areas equalize cooling rates between the gate zone and the surrounding cavity face, reducing the thermal gradient that drives differential packing.
4. Vent Engineering
Under-vented cavities trap compressed air that resists filling and generates burn marks from adiabatic heating. In a multi-cavity tool, uneven venting creates fill resistance differences between cavities — an additional imbalance driver that is separate from runner geometry and thermal effects.
- Semi-crystalline resins (PP, PA, POM): vent depth 0.013–0.019 mm (0.0005–0.00075 in)
- Amorphous resins (PC, ABS): vent depth up to 0.076 mm (0.003 in)
- Land width: minimum 5 mm with SPI-A2 optical polish (Ra 0.025 µm)
- Thin-wall applications (< 0.8 mm): vacuum venting at –0.08 MPa eliminates burn marks and reduces injection pressure requirements by 15–20%
Use pressure-sensitive film on parting lines during clamping verification. Darker regions indicate inadequate venting or excessive clamp pressure at that location. This is a faster diagnostic than measuring vent depths directly on a completed mold.
5. Cavity Pressure Monitoring
Cavity pressure sensors measure the actual filling event inside each cavity, independent of machine-side parameters. Install sensors in 20–25% of cavities, prioritizing geometric extremes — innermost, outermost, and corner cavities — which are most likely to deviate. [2]
Target parameters per shot:
- Peak pressure variation: < ±5 bar across all monitored cavities
- Pressure integral (P-t curve) variance: < 10%
- Post-gate seal time differential: < 0.2 seconds
Modern machines support cavity pressure-based switchover: transfer from velocity to pressure control when 95% of monitored cavities reach target pressure. Automatic rejection of shots where any monitored cavity exceeds variance thresholds prevents out-of-tolerance parts from advancing to assembly without manual intervention.
6. Clamp Force Distribution
Uneven clamping creates dynamic parting line gaps that vary between high-pressure and low-pressure zones across the mold face. High-pressure zones produce flash along the cavity centerline; low-pressure zones cause material starvation at outer cavities. Verify platen parallelism using the blueing technique or laser alignment before production.
- Platen deflection under full clamp tonnage: < 0.02 mm
- Tonnage distribution variation: < 5% across mold surface
Without proper alignment, cyclical micro-movement at the parting line accelerates wear and requires weld repair every 50,000–100,000 cycles instead of the 500,000+ cycles achievable in a well-aligned tool.
Advanced Simulation and Optimization
Moldflow Analysis Protocols
Autodesk Moldflow or Moldex3D simulations must validate balance prior to steel cutting.
Critical Outputs:
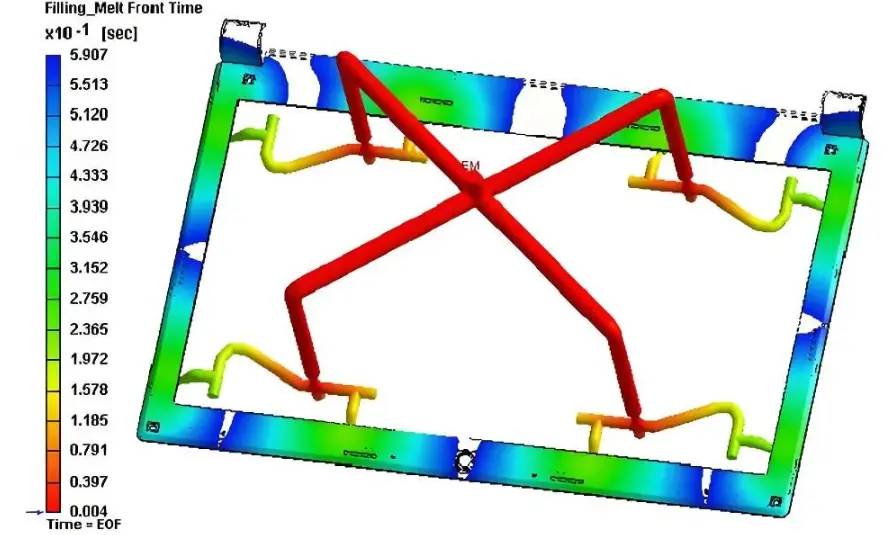
• Fill Pattern Prediction: Visualize flow fronts ensuring all cavities reach 95% fill within ±5% time variance. Identify racetracking and weld lines.
• Runner Sizing Wizard: Calculate optimal diameters for viscous resins using Cross-WLF viscosity models to account for shear-thinning and temperature dependence
• Warpage Correlation: Link differential cooling to final part flatness. For robotic mounting plates requiring <0.1mm/m flatness, cavity-to-cavity shrinkage variance must be <0.05%.
In-Mold Process Control
Real-Time Adaptive Control:
• Cavity Temperature Telemetry: IR sensors monitor melt temperature at gate entry, automatically adjusting hot runner zones ±2°C to maintain balance during ambient fluctuations.
• Machine Learning Algorithms: Self-optimizing press control systems modify injection velocity profiles shot-to-shot based on cavity pressure sensor feedback. This compensates for material batch-to-batch viscosity variation — a significant but often overlooked source of production imbalance, particularly with glass-filled grades where fiber length distribution varies by lot.
Economic Impact of Cavity Balance
The following data comes from a representative 16-cavity medical device program running PC resin at 0.5 mm wall thickness, 1 million cycles annually. The numbers are representative of production programs Fecision validates through Moldflow simulation and cavity pressure monitoring.
| Metric | Unbalanced | Balanced | Impact (16-cavity PC medical, 1M cycles) |
| Scrap rate | 8–15% | < 2% | $45K–$85K annual material savings on a 16-cavity PC medical program |
| Process capability (Cpk) | 0.8–1.0 | ≥ 1.67 | Six Sigma performance — 0.6 ppm defect rate |
| Tool maintenance interval | 50K cycles | 500K+ cycles | 90% reduction in downtime and weld-repair cost |
| Cycle time | 18.5 s | 17.2 s | 7% throughput increase per shift |
| Energy consumption | Baseline | –12% kWh/kg | Lower clamping force variance reduces hydraulic demand |
Hidden Cost Avoidance:
Imbalanced molds create “sorting paralysis”—manual inspection and segregation by cavity number, adding $0.03-$0.05/part labor cost. Balanced systems enable bulk packaging and automated assembly.
Cavity Balance Validation Checklist
Pre-Production Validation (PPAP Level 3):
☐ Simulation Deliverables: Moldflow showing fill time variance <5%; weld line maps; air trap predictions
☐ Hot Runner Certification: Independent PID zone control per cavity (±1°C); thermal imaging verification
☐ Process Validation:
- IQ: Verify cavity machining tolerances per SPI Class 101/102 standards
- OQ: L9 DOE demonstrating robustness at viscosity/temperature extremes
- PQ: 30 consecutive shots with Cpk ≥1.33 (4σ capability) or ≥1.67 (5σ) for critical dimensions
☐ Metrology Planning: CMM inspection n=32 for 16-cavity tool; individual cavity traceability
☐ Sensor Integration: Pressure transducers in 20% of cavities with SPC data logging
Troubleshooting Guide: Three Common Imbalance Symptoms
Inner Cavities Flashing / Outer Cavities Short-Shotting
Root cause: Beaumont Effect — shear heating in the runner system has created a viscosity differential where inner cavities receive lower-viscosity melt.
- Reduce injection velocity 10% to decrease shear rate and slow the Beaumont Effect development
- Implement SVG delay on inner cavity gates (0.3 s) to equalize fill timing
- Lower inner cavity hot runner zone 5°C; raise outer cavity zone 5°C
- Verify outer cavity vent depth — clogged vents add resistance that compounds the under-fill
Cavity-to-Cavity Weight Variation > 2%
Root cause: Non-uniform cooling causing differential packing — one section of the tool is running hotter than another.
- Check cooling line flow rates — confirm turbulent flow (Re > 4,000) in all circuits
- Verify water temperature differential < 2°C per circuit using in/out thermocouples
- Inspect for scale buildup in outer cavity channels — even 0.5 mm of scale reduces heat transfer significantly
- Add BeCu inserts to the slow-cooling cavity areas to equalize heat extraction rates
Random Cavity Burn Marks
Root cause: Uneven venting — gas traps have formed at end-of-fill locations in the affected cavities.
- Verify vent depth with pin gauges per material specifications (semi-crystalline: 0.013–0.019 mm; amorphous: up to 0.076 mm)
- Clean vents with dry ice blasting — solvent cleaning risks swelling vent lands
- Check parting line flatness with blueing technique (target: 80%+ contact across full parting surface)
- Consider vacuum venting (–0.08 MPa) for sections with wall thickness < 0.8 mm
Conclusion
Cavity balance in multi-cavity injection molding is not a runner geometry problem — it is a rheological engineering problem. Geometric symmetry is the starting point, not the solution.
The Beaumont Effect, pressure drop differentials, and thermal stratification all operate simultaneously, and all require design-level countermeasures: melt rotation technology, sequential valve gating, parallel cooling circuits, properly sized vents, and cavity pressure monitoring.
The upfront investment in balanced tooling runs 15–20% above standard tooling cost. It returns within 50,000 cycles through scrap reduction, throughput gains, and elimination of cavity-sorting labor. For medical micro-fluidic devices and aerospace sensor housings requiring ±0.025 mm tolerances, mastery of cavity balance separates commodity molders from precision manufacturing partners.
Fecision provides Moldflow-validated cavity balance analysis with every multi-cavity mold project. Send your part drawing and production volume to discuss your multi-cavity injection mold tooling needs together.
Frequently Asked Questions
What causes imbalance in a geometrically balanced multi-cavity mold?
The primary cause is the Beaumont Effect: shear heating at runner walls creates a temperature stratification across the melt cross-section. When the melt turns at a runner bifurcation, hot and cool regions separate into different downstream branches, causing inner cavities to fill 10–30% faster than outer cavities despite equal flow path lengths.
How do cavity pressure sensors improve balance in multi-cavity production?
Sensors measure actual filling events inside each cavity independently of machine parameters. Peak pressure variation target is ±5 bar across all monitored cavities. When any cavity exceeds variance thresholds, the press automatically rejects the shot. This prevents out-of-tolerance parts from reaching assembly without manual cavity-by-cavity inspection.
Why do inner cavities flash while outer cavities short-shot in the same mold?
This is the classic Beaumont Effect signature: inner cavities receive the hot, low-viscosity portion of the shear-stratified melt and fill faster, causing overpacking and flash. Outer cavities receive cooler, higher-viscosity melt and underfill. Both defects occur simultaneously. The fix is melt rotation technology, sequential valve gating, or hot runner zone temperature profiling.
What is the ROI on investing in cavity balance for a high-volume medical program?
For a representative 16-cavity PC medical program at 1 million cycles annually: balanced tooling reduces scrap from 8–15% to under 2% ($45K–$85K annual material savings), extends tool maintenance intervals from 50,000 to 500,000+ cycles, and reduces cycle time by approximately 7%. The 15–20% tooling premium typically returns within 50,000 production cycles.
How does Moldflow simulation validate cavity balance before tooling?
Moldflow predicts fill pattern timing (all cavities should reach 95% fill within ±5% time variance), weld line locations, air trap positions, and differential shrinkage. For precision programs requiring flatness under 0.1 mm/m, cavity-to-cavity shrinkage variance must be under 0.05% — a threshold that can only be verified through simulation before steel is cut.
References
Accessed May 2026.
[1] Beaumont, J.P. ‘Runner and Gating Design Handbook.’ Hanser Publications. Primary research and commercial application of the MeltFlipper melt rotation technology. https://www.beaumontrunner.com
[2] Kistler Group. Type 6182AE Cavity Pressure Sensor — Technical Specifications. Official Kistler product documentation. https://www.kistler.com/en/products/sensors/pressure-sensors/cavity-pressure-sensors/
[3] Chien, M. et al. ‘Impact of Runner Size, Gate Size, Polymer Viscosity, and Molding Process on Filling Imbalance in Geometrically Balanced Multi-Cavity Injection Molding.’ https://www.ncbi.nlm.nih.gov/pmc/articles/PMC11511498/